A smart prototype concept for controlled drain/sewer gas collection, real-time monitoring, gas treatment, low-pressure storage, and renewable energy recovery.
Methane CH₄ Level
Hydrogen Sulfide H₂S
Storage Pressure
Estimated Electricity / Day
Dashboard values are demo/simulation data for prototype presentation. Real deployment requires certified sensors, trained supervision, and legal permission.
| Parameter | Reading | Status | Purpose |
|---|---|---|---|
| CH₄ | 45.0% | Energy Available | Fuel gas measurement |
| H₂S | 38 ppm | Needs Filter | Toxic/corrosive gas monitoring |
| O₂ | 1.2% | Low Air Entry | Air mixing and explosion-risk control |
| Pressure | 8.2 kPa | Stable | Low-pressure storage monitoring |
This section shows how the whole Waste-to-Watts prototype can be monitored and controlled from one smart control system.
The main controller receives sensor data, checks safety conditions, stores readings, and sends commands to system devices.
All important system readings are collected from sensors and shown on the dashboard.
The controller can manage safety and flow-control devices in the prototype system.
| Step | Control Action | Purpose |
|---|---|---|
| 1 | Read sensor data | Collect CH₄, H₂S, O₂, LEL, pressure and flow data |
| 2 | Analyze safety status | Compare readings with safe operating limits |
| 3 | Update dashboard | Show live system condition to the operator |
| 4 | Store data log | Save readings for research and performance analysis |
| 5 | Trigger safety response | Activate alarm, ventilation, or emergency shut-off when unsafe |
| 6 | Report energy output | Calculate methane volume, thermal energy and electrical output |
Gas quality is acceptable, pressure is stable, and the system continues monitoring and energy recovery.
H₂S, oxygen, pressure or flow values move toward unsafe range; alarm and operator notification are activated.
Unsafe gas condition is detected; the system stops energy recovery, triggers alarm, and activates emergency control response.
At each time step, the controller stores a complete system data record:
D(t) = [CH₄(t), H₂S(t), O₂(t), LEL(t), P(t), Q(t), Vg(t), E(t), SafetyStatus(t)]
The system status can be represented as:
SafetyStatus = f(CH₄, H₂S, O₂, LEL, Pressure, Leakage)
This makes the prototype useful for research, safety analysis, performance measurement, and renewable-energy output estimation.
This page works as a simulated control-room interface for the Waste-to-Watts prototype. It shows all units, live data, device status, alarms, and switch controls in one dashboard.
Login is required before opening the full control panel.
| Flow Stage | Flow Rate | Pressure | Loss / Drop | Status |
|---|---|---|---|---|
| 1. Collection Hood / Raw Gas Line | 0.20 m³/h | 8.2 kPa | Baseline | Receiving Gas |
| 2. Condensate Trap / Moisture Separator | 0.19 m³/h | 7.8 kPa | 5% | Moisture Removed |
| 3. H₂S Removal Filter | 0.18 m³/h | 7.3 kPa | 10% | Filter Load |
| 4. Particulate Filter + Low-Pressure Blower | 0.17 m³/h | 6.9 kPa | 15% | Clean Flow |
| 5. Gas Holder Storage Inlet | 0.17 m³/h | 6.6 kPa | 17% | Stored |
| 6. Regulator to Energy Recovery Unit | 0.12 m³/h | 5.8 kPa | 40% | Usable Output |
A more gorgeous and realistic workflow view showing raw sewer gas moving from drain source to collection, monitoring, treatment, storage and energy recovery.
Organic urban waste decomposes in low-oxygen drain or sewer conditions.
A sealed hood captures gas from the headspace and reduces air entry.
Sensors check methane, toxic gas, oxygen and explosive-risk level.
Moisture, hydrogen sulfide and particulates are removed before use.
Treated gas is stored at low pressure and used for energy output.
Raw gas is generated from biodegradable waste decomposition.
Black particles show raw gas flow. Golden particles show treated gas flow.
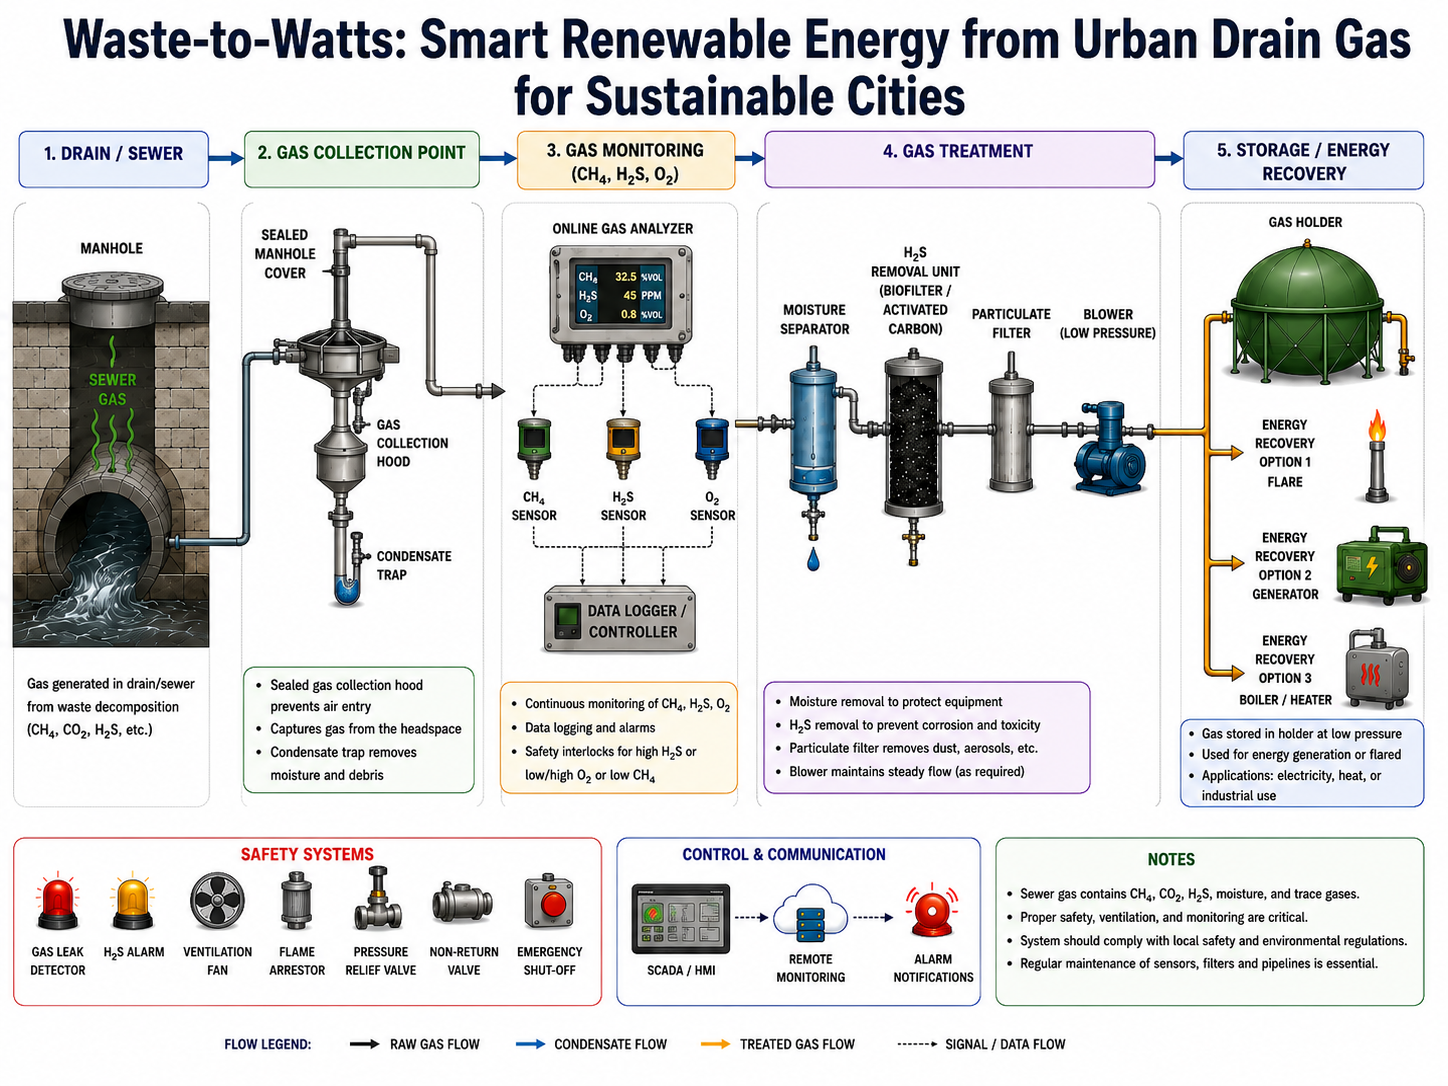
This section follows your system architecture: source, collection, monitoring, treatment, storage, safety system, communication, and energy recovery.
Gas is produced from organic waste decomposition.
Controlled collection hood captures gas from headspace.
Sensors monitor CH₄, H₂S, O₂, and LEL risk.
Moisture, H₂S, and particulates are reduced.
Cleaned gas is stored at low pressure.
Gas can be used for flaring, heating, or generator testing.
Alarm, ventilation, flame arrestor, and emergency shut-off.
Dashboard, data logger, and remote monitoring concept.
Bangladesh’s urban areas produce large amounts of wastewater, sewage sludge, food waste, and biodegradable organic waste every day. In drains and sewer lines, these wastes decompose under low-oxygen conditions and produce gases such as methane, carbon dioxide, hydrogen sulfide, water vapor, and other trace gases.
Usually, this gas escapes into the environment, causing bad odor, health risks, fire hazards, and greenhouse gas emissions. However, methane is an energy-rich gas and can become a renewable energy source if safely handled.
The objective of this project is to develop a smart prototype system that can collect gas from a controlled drain or sewer point, monitor its composition, remove harmful impurities, store it safely at low pressure, and convert it into useful renewable energy for heating, cooking demonstration, or small-scale electricity generation.
The proposed system includes a gas collection point, gas monitoring unit, moisture separator, hydrogen sulfide removal filter, particulate filter, low-pressure gas holder, pressure regulator, and energy recovery unit. The monitoring system measures methane, hydrogen sulfide, oxygen, and explosive-risk level. The innovation is that the project treats urban drain gas not only as a pollution and safety problem but also as a recoverable renewable-energy resource with mathematical modelling for gas flow, methane volume, thermal energy, electrical output, treatment efficiency, and carbon-emission reduction.
The final electrical output depends on gas volume, methane fraction, treatment efficiency, and generator efficiency.
Gas flow rate:
Qg = Vg / t
Methane volume:
VCH₄ = Vg × yCH₄
Thermal energy:
Ethermal = VCH₄ × 35.8 MJ/m³
Electrical output:
Eelectric = (Vg × yCH₄ × 35.8 / 3.6) × ηt × ηg
These values are theoretical and must be validated through safe prototype testing.
Use this dashboard calculator to estimate renewable energy output from your prototype data.
This website presents the concept as a supervised university prototype. Field testing should only be done with institutional permission, trained supervision, certified gas detectors, PPE, ventilation, emergency shut-off, low-pressure storage, and legal compliance.
Replace the placeholder details with your university, team name, department, phone, and email before submission.
Team Name: [Your Team Name]
Project: Waste-to-Watts
University: [Your University Name]
Department: [Your Department]
Email: your.email@example.com